The related information of correlation is mostly from David Dorran video at youtube, it is very clear and easy understanding.
What Is Correlation
Correlation is a measure of how similar signals are. They are present in things like discrete Fourier transform.
Which is always present as equation:
Eq. (1)
$$Corr_{x,y} = \sum_{n=0}^{N-1}x[n]\cdot y[n]$$
Where $x[n]$ and $y[n]$ are two discrte function.
Here gives an example,
$x=$
$$\begin{bmatrix}1&3&-2&4\\end{bmatrix}$$
$y=$
$$\begin{bmatrix}2&3&-1&3\\end{bmatrix}$$
$z=$
$$\begin{bmatrix}2&-1&4&-2\\end{bmatrix}$$
plot them in matlab, we get this
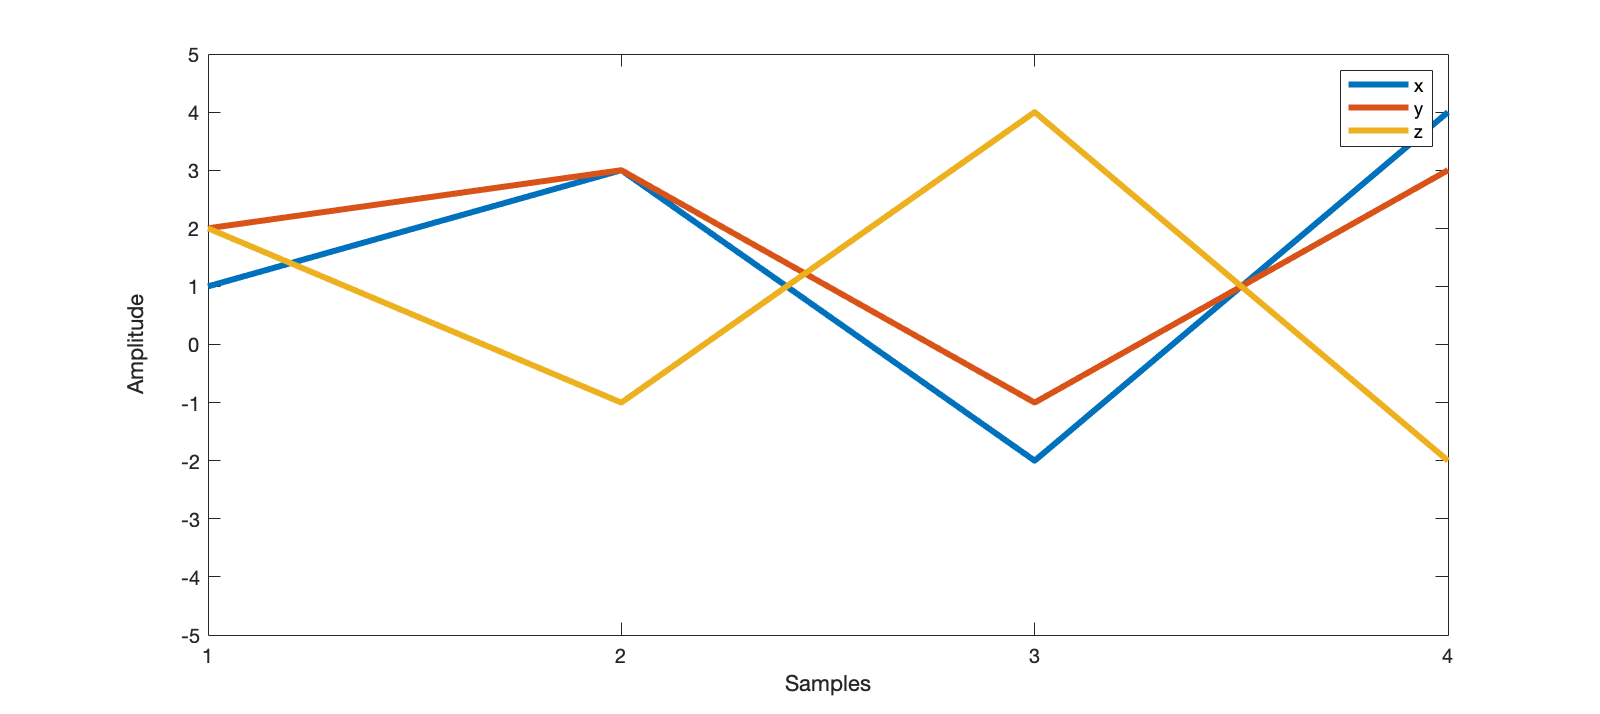
From this figure we can find x is similar with y but not similar with z. How we can describe this in mathematics?
We substitute x, y and y, z into Eq. (1),
$$
\begin{aligned} \operatorname{Corr}_{x, y} &=x[0] y[0]+x[1] y[1]+x[2] y[2]+x[3] y[3] \ &=(1)(2)+(3)(3)+(-2)(-1)+(4)(3) \ &=2+9+2+12=25 \end{aligned}
$$
and
$$
\begin{aligned} \operatorname{Corr}_{y,z} &= y[0]z[0] + y[1]z[1] + y[2]z[2] + y[3]z[3] \ &= (2)(2)+(3)(-1)+(-1)(4)+(3)(-2) \ &= -9 \end{aligned}
$$
However if we substitute the first 2 in Z into 100, which will lead to $Corr_{y,z} = 187$, and we will become confused, because we can’t get clearly which two are more similar with the other. as seen in the figure:
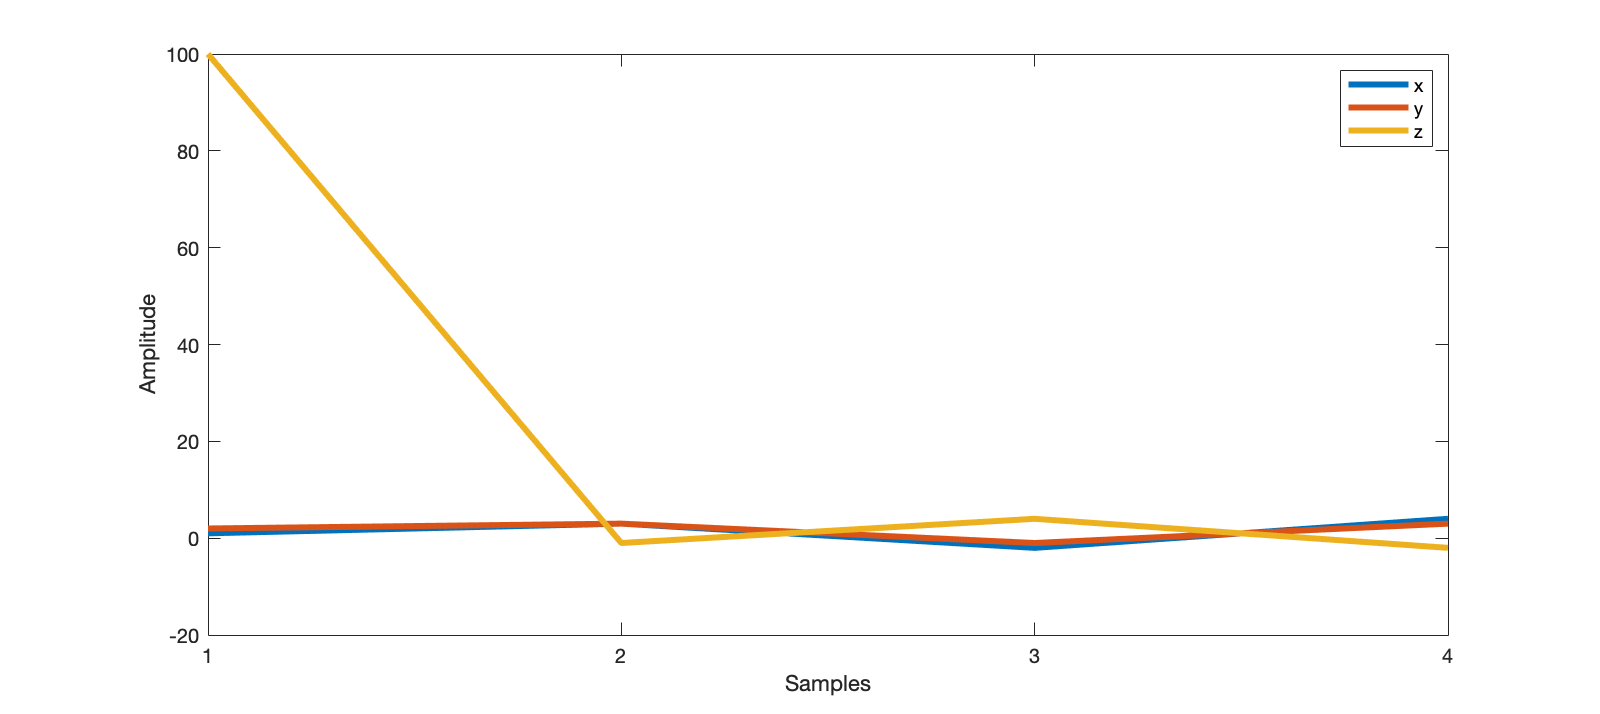
So here we need Normalised Correlation.
$$
\operatorname{Corr}{norm{x,y}}=\frac{\sum_{n=0}^{N-1} x[n]y[n]}{\sqrt{\sum_{n=0}^{N-1} x^{2}[n] \sum_{n=0}^{N-1} y^{2}[n]}}
$$
The two terms at denominator are the measure of energy in signal X and Y respectively, which make the denominator the overall scaling factor.
Basically, this normalised correlation function is this result divided by a scaling factor which is related to the energy that’s contained in the signals that you are measuring the similarity.
For $Corr_{x,y}=0.95$ and $Corr_{y,z}=0.38$, $Corr$ ranges in $[-1, 1]$. Which can well score the similarity.
It’s worth noting that, sometimes, as seen in the code demo:
% This code highlights where non normalised correlation is |
The output is:
>> NormalisedCorrelation |